

BY HERMAN
“We’ve struggled over the last couple of years, our top draft picks have under-performed”
“We haven’t done well in the draft. [INSERT PLAYER NAME] was a number one draft pick and he hasn’t really kicked on. It’s really hurt us”
I’m sure you’ve heard this sort of stuff before (especially from Carlton supporters). As fans we love searching for excuses for why our side has sucked balls over the last few years and why the next couple of years will be different. After a friend made a similar statement about their team and how they hadn’t done well with their top draft picks, I decided to have a look at it. How does draft performance affect the chances of your side winning the premiership?
The first thing I did was download all the data from previous drafts. It’s simply the player a club was drafted to and the number of games they have played. No adjustment is made for where those players ended up playing games over their career. If they were drafted to a side, they count towards that side. That is, no effort has been made to look into the effect of trades on premierships.
I have excluded GWS and the Gold Coast and the 2014 draft because there simply hasn’t been enough time to see how those players/clubs perform. That means the data set runs from 1991-2013. The 2014 premiership has been included because it takes years to build a premiership winning side. That left me with 16 teams and plenty of data. It’s not a perfect data set or perfect analysis by any means (it may have been smart to exclude a few more years for example), but this is a sports blog and I don’t care enough to do this proper properly (Ed note: Seems legit).
After that I calculated the average number of games played by all players drafted to each club and the average number of games played by top 30 draft picks at each club (an arbitrary cut off that seemed to make sense to me). A quick aside, on average players drafted to the AFL play roughly 58 games. Top 30 picks do much better, averaging 86.3 games.
So how do the clubs fare when it comes to picking talent in the top 30 picks? Over the years Adelaide have been the worst team, getting on average 13 less games per top 30 pick compared to the competition. St Kilda have been the kings of the pointy part of the draft, getting almost 16 games more per top 30 pick than other clubs. The question though, it does this actually mean much when it comes to premierships? The answer after the jump.
| Team drafted | Top 30 picks | AFL average | Difference | Premierships |
| Adelaide | 73.2 | 86.3 | -13.1 | 2.0 |
| Collingwood | 73.5 | 86.3 | -12.8 | 1.0 |
| North Melbourne | 80.1 | 86.3 | -6.2 | 1.0 |
| Brisbane | 80.2 | 86.3 | -6.1 | 3.0 |
| Richmond | 80.9 | 86.3 | -5.4 | 0.0 |
| Essendon | 83.4 | 86.3 | -2.9 | 2.0 |
| Melbourne | 85.1 | 86.3 | -1.2 | 0.0 |
| West Coast | 85.5 | 86.3 | -0.8 | 3.0 |
| Sydney | 86.0 | 86.3 | -0.3 | 3.0 |
| Geelong | 88.1 | 86.3 | 1.8 | 3.0 |
| Port Adelaide | 90.7 | 86.3 | 4.4 | 1.0 |
| Fremantle | 90.7 | 86.3 | 4.4 | 0.0 |
| Carlton | 90.8 | 86.3 | 4.5 | 1.0 |
| Western Bulldogs | 93.6 | 86.3 | 7.3 | 0.0 |
| Hawthorn | 96.9 | 86.3 | 10.6 | 4.0 |
| St Kilda | 102.1 | 86.3 | 15.8 | 0.0 |
No. Graphing premierships vs performance in the top 30 picks gives up a woeful correlation of pretty much zero. At least historically, performance at the top of the draft doesn’t win you premierships. We will cover why this might be the case in detail later on.

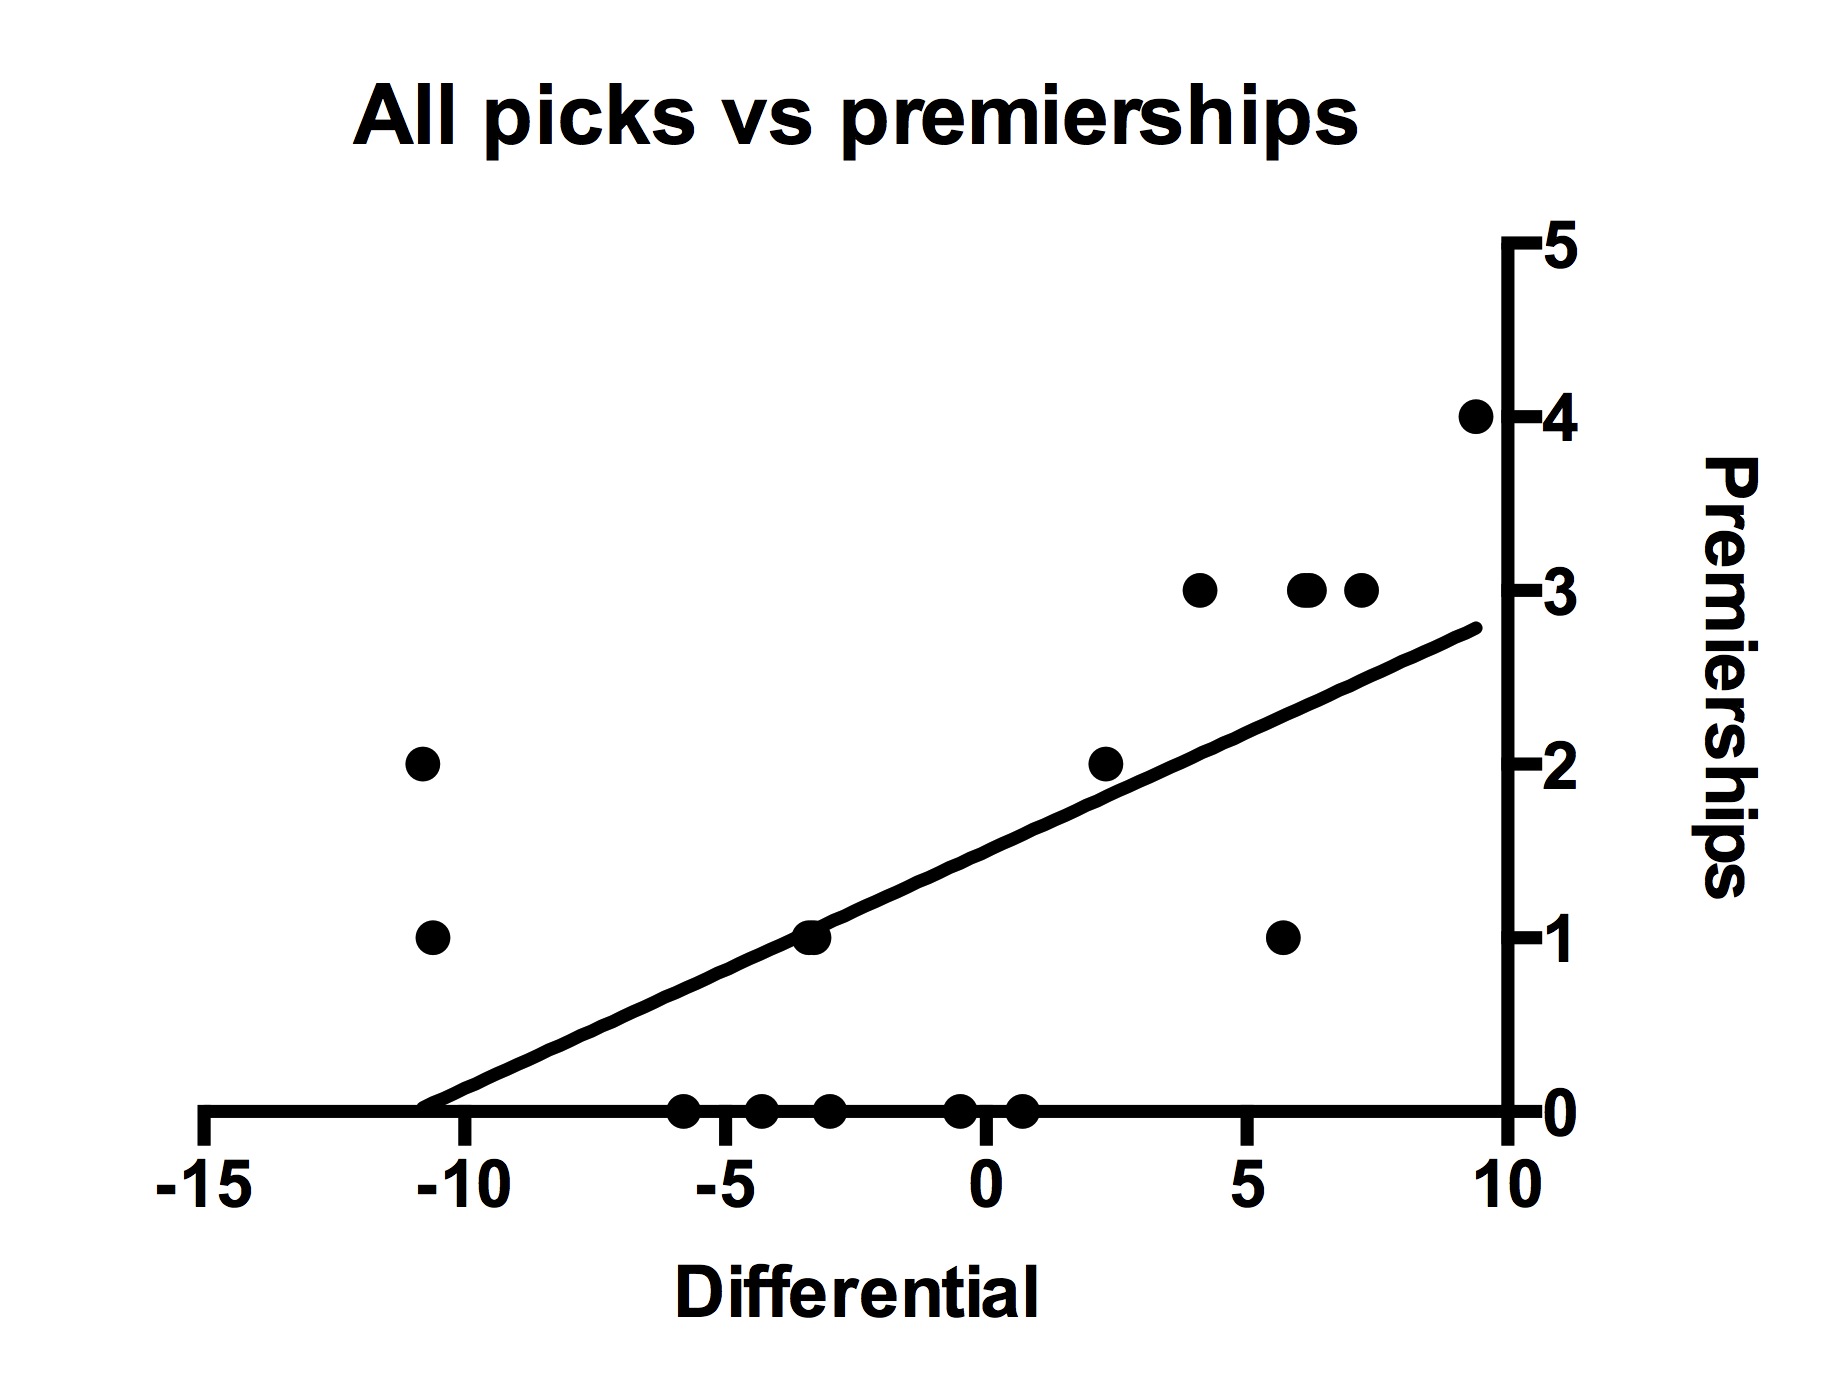
Now its time to look at overall performance in the draft. That’s everyone a club drafts not just the cream. Which clubs excel at picking talent and which clubs suck?
The worst performer is once again Adelaide (Adelaide are terrible at picking talent), getting almost 11 games less per draftee than the average. The best performer is Hawthorn, getting on average almost 9 and a half games more per draftee. The question though, is does this actually help us explain premierships?
| Team drafted | All | AFL average | Difference | Premierships |
| Adelaide | 47.2 | 58.0 | -10.8 | 2.0 |
| Carlton | 47.4 | 58.0 | -10.6 | 1.0 |
| Richmond | 52.2 | 58.0 | -5.8 | 0 |
| Melbourne | 53.7 | 58.0 | -4.3 | 0 |
| Collingwood | 54.5 | 58.0 | -3.4 | 1.0 |
| North Melbourne | 54.7 | 58.0 | -3.3 | 1.0 |
| Western Bulldogs | 54.9 | 58.0 | -3.0 | 0 |
| St Kilda | 57.5 | 58.0 | -0.5 | 0 |
| Fremantle | 58.7 | 58.0 | 0.7 | 0 |
| Essendon | 60.3 | 58.0 | 2.3 | 2.0 |
| Sydney | 62.1 | 58.0 | 4.1 | 3.0 |
| Port Adelaide | 63.7 | 58.0 | 5.7 | 1.0 |
| Geelong | 64.1 | 58.0 | 6.1 | 3.0 |
| West Coast | 64.2 | 58.0 | 6.2 | 3.0 |
| Brisbane | 65.2 | 58.0 | 7.2 | 3.0 |
| Hawthorn | 67.4 | 58.0 | 9.4 | 4.0 |
Yes! In this case, how teams perform at picking talent across the draft does appear to have some explanatory power when it comes to explaining premierships. In this case the r2= 0.39, which means that ~39% of variation in premierships can be explained by overall draft performance. How your team perform in talent identification across the draft definitely matters.
These results suggest that as fans we shouldn’t be getting too hung up on the performance of our top draft picks. Yes, some succeed and some fail, but that is par for the course (there is a lot of variance at every position). What we should instead be focussing on is whether our clubs are getting value across the draft because that’s what really matters.
If we think about it this makes sense. The top picks are the absolute stand out talents. The top 10 or so players identified by each club are likely to be more or less the same – that is the absolute cream of the crop will have been noticed by everybody. These players are more likely to be successful*, but access to them is limited due to how the draft is structured. Only the worst teams get regular access to top draft picks. This improves the performance of the worst sides, making the competition one of the most even in the world over the long term (the “cycle”). However, it won’t win them a premiership. To do that, they need something more. So when it comes to premierships, it’s time to take the focus off the top of the draft.
To win a premiership, you need to build a strong team and doing that relies on getting value across the draft. You have to find a way to get an advantage over the competition to make the jump from decent, to excellent.
So how best to do this? Where is “value” in the draft most likely to be? To get an idea of this I simply averaged out the number of games played by draft picks in all positions and then ranked the picks according to the number of games played. I then calculated the difference between the rank and the pick number. So without further ado, the worst performing picks are as follows.
| pick | Rank | Diference |
| 6 | 39 | -33 |
| 35 | 67 | -32 |
| 22 | 52 | -30 |
| 23 | 41 | -18 |
| 51 | 69 | -18 |
| 30 | 47 | -17 |
| 34 | 51 | -17 |
| 28 | 42 | -14 |
| 54 | 68 | -14 |
| 39 | 49 | -10 |
As you can see, the infamous pick 6 is not alone. Pick 35 and pick 22 are almost just as bad.
Now for the best picks!
| Pick | Rank | Diference |
| 56 | 18 | 38 |
| 40 | 9 | 31 |
| 55 | 26 | 29 |
| 67 | 44 | 23 |
| 37 | 17 | 20 |
| 47 | 28 | 19 |
| 53 | 35 | 18 |
| 66 | 48 | 18 |
| 46 | 29 | 17 |
| 43 | 27 | 16 |
And here is how well ranks and picks correlate. This suggest that overall AFL clubs are relatively decent at ranking players on average. Bare in mind though, that there is a lot of variance for the number of games played by players picked in each position.

Now, let’s compare the two lists. The average pick position for picks on the worst list is 32 (35 if you exclude pick 6 because of its magical powers). The average pick position for picks in the “best” list is pick 51. As you might notice, both the “best” and “worst” picks generally sit somewhere in the middle of the draft. This makes sense for a number of reasons. As discussed above, at the top of the list, the clubs will all be very good at picking the cream of the crop. Those guys with that X factor, something special, the guys that really stand out. For the same reasons they should also be able to pick the “worst”, those guys that really don’t look like they can cut it. In the case of the draft though, most of those guys won’t get drafted.
So we might expect their predictions to be relatively good at the top and bottom. It’s in the middle that things get hard. In the middle clubs are picking between players of a similar standard, players that don’t really stand out from each other, that aren’t obviously very good or very bad. Despite very little to split them, the careers of those players will have wildly different trajectories. Some will be greats, some will never play a game. You can imagine how picking between these players of very similar talent may be a bit of a lottery for many AFL clubs. For these reasons, it is no surprise that it is the middle of the draft that has both the best and worst performing picks.
The importance of these picks becomes clear when we look at how the draft is structured. Picks at the top are heavily weighted in favour of poorly performing clubs. Picks in the middle however are not. Even the best clubs get numerous picks in the middle of the draft every year. A bit of luck or better than average talent identification can mean that already good clubs can pick up very good players year after year after year despite never getting a pick right at the top of the draft. In fact the data suggest that being able to do just that is a very important part of putting together a squad that can win a premiership. Performance in the middle of the draft matters. To win a premiership it matters a lot.
Much like on the field, winning a premiership through the draft is reliant on having a strong middle.
*
| Picks | Average games |
| 1 to 10 | 109.27 |
| 11 to 20 | 84.82 |
| 21 to 30 | 58.63 |
| 31 to 40 | 58.49 |
| 41 to 50 | 51.99 |
| 51 to 60 | 39.37 |
| 61 to 70 | 32.79 |
